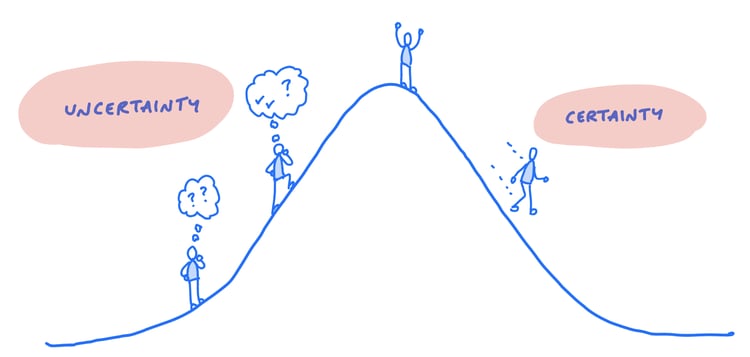
I read something recently that struck me as a really good idea for our team. Usually that feeling goes away after a couple of hours (“nah, it’s cool but not a good fit for us”) — but not this time. In Running in Circles, Ryan Singer talks about the knowns/unknowns in a project like a hill:
The most important question for a team isn’t “what is left?” but “what is unknown?” Can you see the edges? Have you gone in there and seen everything that needs to change? The only way to gain certainty is to roll up your sleeves and engage with the reality of problem.
At Basecamp our teams seek out the areas with the scariest unknowns and work on them first. This uphill work requires strategies. We wrote about these in Getting Real. Open the code, spike something that works, load it with real data and try it. When the whole feature is too big to prototype, factor out the most important pieces and spike them.
He has a a nice visualization of it:
He also uses an example from a recent project to show how they map this out:
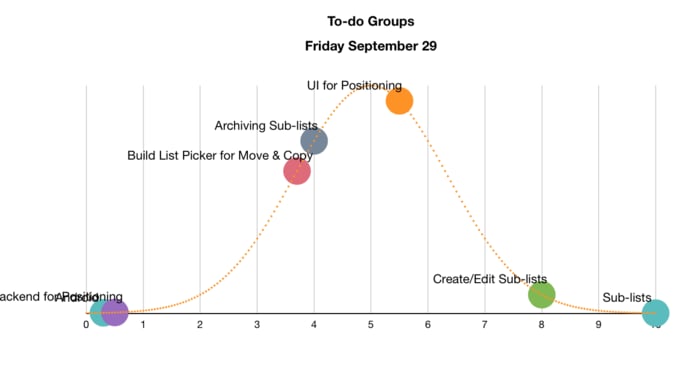
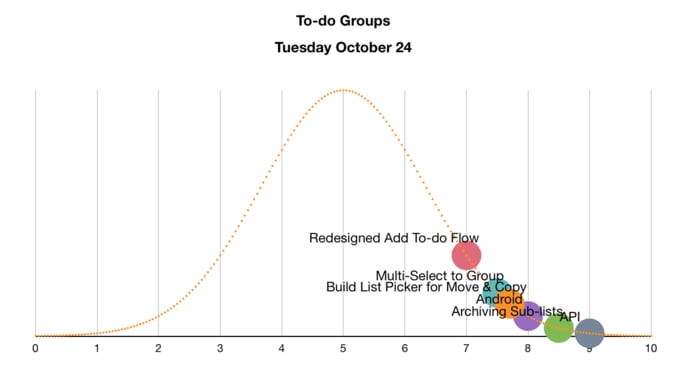
As they “move over the hill”, different parts of the project become known, and they become more certain about what’s left to do. We’re working on some checklists to identify development risks before we start a project, and this looks like a great way to visualize those risks and track them as you go.